Tuesday, July 15, 2008

SQL Server Audit in SQL Server 2008

SQL Server 2008 February CTP introduces a new feature, SQL Server Audit. This feature facilitates auditing of Database Engine events by providing simple T-SQL statements to enable, store, and view audits on server and database objects. Compared to auditing with SQL Server trace files, using SQL Server Audit is much easier and cleaner. SQL Server Audit is implemented in the SQL Server Extended Events infrastructure. Extended events are created by the T-SQL statements to record the occurrences of the auditable actions.


To implement SQL Server audits, you first need to create a SQL Server Audit object. This object collects server and/or database-level actions and groups of actions that you want to monitor. It is created at the SQL Server instance level. You can have multiple SQL Server Audit objects per SQL Server instance. In the SQL Server Audit object, you specify the location for the output of the audit results. The results can be written to a binary file, the Windows Application Log, or the Windows Security Log. The file or the log is the Target component and the consumer of the associated extended events. Then you create Server or Database Audit Specification objects that belong to the SQL Server audit object. A Server Audit Specification collects server-level actions grouped in server audit action groups. It cannot collect individual actions.


However, a Database Audit Specification collects both database-level audit action groups and individual actions.


In Part I of this series, we will focus on the server level events. Server audit action groups record logon and logoff operations, server principal changes, server and database role membership changes, database maintenance operations, server object changes, database object changes, server and database statement and object permission changes. Any database related action groups are collected on all the databases on the server instance.

For example, DATABASE_ROLE_MEMBER_CHANGE_GROUP in a Server Audit Specification collects any actions that add or remove a login from a database role in any database on the server. If you want to audit only one database, you will need to define a Database Audit Specification in that specific database.
As part of the auditing requirements, we would like to monitor server logins and their server-level permission changes. To monitor login additions and deletions, we can include the SERVER_PRINCIPAL_CHANGE_GROUP audit action group in our server audit specification. Server-level permissions can be changed by issuing GRANT, REVOKE, or DENY, or through assigning server role memberships. Therefore, we can include the SERVER_PERMISSION_CHANGE_GROUP and SERVER_ROLE_MEMBER_CHANGE_GROUP audit action groups.
In this script, we write the audit to the Application Log.

/* Create a SQL Server Audit Object that writes the audit results to the Windows Application Log every one second.
If the write fails, the instance continues running without stopping. */


CREATE SERVER AUDIT MyServerAudit
TO APPLICATION_LOG
WITH ( QUEUE_DELAY = 1000, ON_FAILURE = CONTINUE);

/* Create a Server Audit Specification object for the server audit.
This object include three audit action groups related to server principal changes. */


CREATE SERVER AUDIT SPECIFICATION MyServerAuditSpecification
FOR SERVER AUDIT MyServerAudit
ADD (SERVER_PRINCIPAL_CHANGE_GROUP),
ADD (SERVER_PERMISSION_CHANGE_GROUP),
ADD (SERVER_ROLE_MEMBER_CHANGE_GROUP);

/* By default, both the audit and audit specification are created in the disabled state.
We need to enable them before using them to record actions. */
ALTER SERVER AUDIT SPECIFICATION MyServerAuditSpecification
WITH (STATE = ON);
ALTER SERVER AUDIT MyServerAudit
WITH (STATE = ON);


You can confirm that the server audit object and the server audit specification object have been created by selecting from the system views shown below.SELECT * FROM sys.server_audits

SELECT * FROM sys.server_audit_specifications
To confirm that an extended event session has been created, we can select from the extended events dynamic management views.select s.name as [session name], se.event_name as [event name], p.name as [package name], t.target_name as [target name]
from sys.dm_xe_sessions s
join sys.dm_xe_session_events se on s.address = se.event_session_address
join sys.dm_xe_packages p on se.event_package_guid = p.guid
join sys.dm_xe_session_targets t on s.address=t.event_session_address


As we can see above, an extended event session called MyServerAudit$A was created. It includes the audit_event from the SecAdudit package. The audit is written to Application Event log asynchronously.
Let’s test this script by adding a login called testlogin. Grant the View Server State permission to the login, and add it to the dbcreator role.CREATE LOGIN testLogin WITH PASSWORD = 'Welcome123'
GRANT VIEW SERVER STATE TO testLogin
EXEC sp_addsrvrolemember 'testLogin', 'dbcreator'
DROP LOGIN testLogin


We can examine the Application Log by running the Windows Powershell command below.


Get-EventLog -logname "application" -newest 4 where {$_.Source -eq 'MSSQLSERVER' } select EntryType, EventID, Message, TimeGenerated format-list


Tuesday, July 1, 2008

Integrating Telephony Services Into .NET Applications


Software developers have had limited access to telecom networks and capabilities. Specialized computer-telephony integration protocols are too complex and inflexible to properly link telephony services into enterprise business applications. As such, integrating person-to-person calling, conferencing, and call routing capabilities such as find me-follow me into applications has always been the preserve of specialized developers. As organizations continually attempt to increase the efficiency of their business processes through communications, the inability to easily tie communications services into the fabric of daily operational processes has emerged as a serious obstacle to business profitability.

With the advent of next-generation IP communications, Session Initiation Protocol (SIP), and Web services, these barriers to interconnectivity are being deconstructed. IT and communications systems now share a common language. However, developers are still faced with a lack of easy-to-use development tools to take advantage of this new interconnection capability. In particular, developers using Microsoft’s .NET Framework are challenged by the lack of tools to discover and incorporate telephony services into their business applications. SIP Objects.NET from Inova IT fills this void


you can download the white paper from below URL
http://lippisreport.com/2007/09/12/integrating-telephony-services-into-net-applications/

Wednesday, November 14, 2007

Search into database tables - Without Cursors

Is there such a thing as a task where you would not need a cursor? Hidden in the depths of the master database are a series of stored procedures that can replace some cursors with these one-liners. Behind the scenes, cursors are still used, but they will save you tons of development time.
Traditionally if you wanted to run a DBCC CHECKTABLE on every table in a database you'd have to write an elaborate cursor like below :


create table #Result
(
tablename nvarchar(1000),
columnname nvarchar(1000),
searchvalue nvarchar(1000)
)


declare @searchstring as varchar(1000)
declare @searchscript as varchar(2000)
set @searchstring = 'Hossam'
set @searchscript =
'declare @sql as varchar(8000)
set @sql = ''select '''''''' tablename,'''''''' columnname,'''''''' value where 1=0''
select
@sql = @sql + '' union all select ''''?'''','''''' +
name + '''''',['' + name + ''] from ? where ['' + name + ''] like ''''%' + @searchstring + '%''''''
from
syscolumns
where
xtype in (175,239,231,167)
and id=object_id(''?'')
insert into #Result
Exec (@sql)
print ''search is completed on ?.'''
exec sp_msforeachtable @searchscript
select * from #Result
--drop table #Result

Tuesday, November 6, 2007

Microsoft Windows PowerShell and SQL Server 2005 SMO

As you probably know, Windows PowerShell is the new command shell and scripting language that provides a command line environment for interactive exploration and administration of computers. In addition, it provides an opportunity to script these commands so that we can schedule and run these scripts multiple times.

Windows PowerShell depends on .NET framework 2.0. SQL Server Management Objects, known as SMO, is an object model for SQL Server and its configuration settings. SMO-based applications use .NET Framework languages to program against this in-memory object model, rather than sending Transact-SQL (T-SQL) commands to SQL Server to do so.

In this article series, I am going to illustrate the power of Windows PowerShell in conjunction with SQL Server 2005. Part I of this series is going to illustrate how to install and use a simple PowerShell command and a simple SMO command.
Assumption
a. The machine you use already has .NET 2.0 installed b. The machine you use already has SQL Server 2005 client installed with the latest service pack Download and Install Microsoft PowerShell.
Download Microsoft PowerShell “WindowsXP-KB926139-x86-ENU.exe” from http://download.microsoft.com/
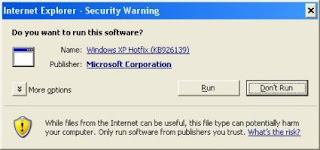
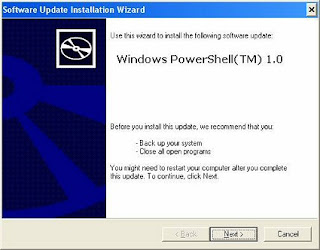
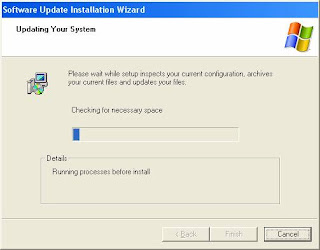
b. Install PowerShell Step 1: Double click on the “WindowsXP-KB926139-x86-ENU.exe’ executable. [Refer Fig 1.0]


Fig 1.0


Launch PowerShell
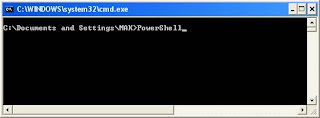
There are few ways to launch PowerShell. One method is to go to the command prompt and type the following command. [Refer Fig 1.6]


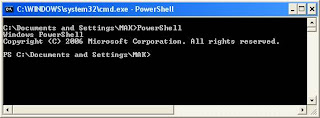
After a short pause, the PowerShell prompt appears. [Refer Fig 1.7]


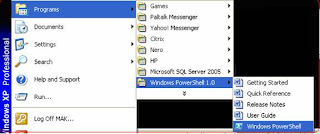
Alternatively, you can start PowerShell by selecting Programs-Windows PowerShell 1.0-Windows PowerShell. [Refer Fig 1.8]


Tuesday, October 30, 2007

Setting the default Button in ASP.NET

to set default button in ASp.net 2.0 is to easy but in asp.net 1.0 i think every one will be facing the problem i hade faced.
i try to use many ways to solve this problem and finally solve it by the below Syntax put it in your page load and replace the text name with your text on the page and the button y need to make it the default button and happy code


txt_Search.Attributes.Add("onkeydown", "if(event.which event.keyCode){if ((event.which == 13) (event.keyCode == 13)) {document.getElementById('" + Me.btn_Search.UniqueID + "').click();return false;}} else {return true}; ")

:)

Tuesday, October 9, 2007

SQL Server 2008 New Featuers

SQL Server 2008 contains many new features and enhancements, Additional information can be found at the main SQL 2008 Microsoft page: http://www.microsoft.com/sql/2008/default.mspx. Listed below is a concise bulleted list of the SQL Server 2008 features .


  1. Transparent Data Encryption. The ability to encrypt an entire database.
  2. Backup Encryption. Executed at backup time to prevent tampering.
  3. External Key Management. Storing Keys separate from the data.
  4. Auditing. Monitoring of data access.
  5. Data Compression. Fact Table size reduction and improved performance.
  6. Resource Governor. Restrict users or groups from consuming high levels or resources.
  7. Hot Plug CPU. Add CPUs on the fly.
  8. Performance Studio. Collection of performance monitoring tools.
  9. Installation improvements. Disk images and service pack uninstall options.
  10. Dynamic Development. New ADO and Visual Studio options as well as Dot Net 3.
  11. Entity Data Services. Line Of Business (LOB) framework and Entity Query Language (eSQL)
  12. LINQ. Development query language for access multiple types of data such as SQL and XML.
  13. Data Synchronizing. Development of frequently disconnected applications.
  14. Large UDT. No size restriction on UDT.
  15. Dates and Times. New data types: Date, Time, Date Time Offset.
  16. File Stream. New data type VarBinary(Max) FileStream for managing binary data.
  17. Table Value Parameters. The ability to pass an entire table to a stored procedure.
  18. Spatial Data. Data type for storing Latitude, Longitude, and GPS entries.
  19. Full Text Search. Native Indexes, thesaurus as metadata, and backup ability.
  20. Reporting Server. Improved memory management.
  21. SQL Server Integration Service. Improved multiprocessor support and faster lookups.
  22. MERGE. TSQL command combining Insert, Update, and Delete.
  23. SQL Server Analysis Server. Stack improvements, faster block computations.
  24. SQL Server Reporting Server. Improved memory management and better rendering.
  25. Microsoft Office 2007. Use OFFICE as an SSRS template. SSRS to WORD

Wednesday, July 11, 2007

Monitoring Stored Procedure Usage

I was attending a SQL Server event a few weeks back when a number of DBA types were talking about new features in SQL Server 2005. One of the topics that came up was how might you monitor execution of stored procedures. One DBA said it would be nice if he had a method to identify how many times a stored procedure (SP) was executed. He was looking for some information to help fine tune his environment and the applications running in his environment. Or at least identify the processes that where run frequently so they could be reviewed by developers to determine if they could be written more efficiently. So what new features in SQL Server 2005 might be used to accomplish the monitoring of SP executions? Dynamic Management views (DMV) of course. In this article I will show you how you can use a few DMV’s to identify the most frequently run SPs of an instance of SQL Server, as well as those SPs that use the most CPU, I/O or run the longest.

Execution Statistics
It is relatively easy to identify the use count and resource usage of your SP’s, but first let me discuss how SQL Server maintains the execution statistics. The SQL Server engine keeps execution statistics for each SQL Server 2005 instance. Execution Statistics are an accumulation of execution information about what has been run since the instances has started. Each time an instance is stopped and restarted all execution statistics are reset.

Individual execution statistics for an object are tied to cached execution plans. When a SP is compiled, an execution plan is cached in memory. These cached execution plans are uniquely identified by a plan_handle. Since memory is limited, SQL Server from time to time will remove execution plans from memory, if the cached plan is not being actively used. Therefore the statistics stored for a particular SP may be for an accumulation of stats since SQL Server started, if the SP has only be compiled once. Or, it may only have statistics for the last few minutes if the SP had recently been compiled.

How to Get the Execution Count of a Stored Procedure?
To determine how many times a stored procedure in the cache has been executed you need to use a couple of DMV’s and a dynamic management function (DMF). The plan_handle for the cached plans are used to join together the DMVs and retrieve records for a DMF. To get the execution counts for each cached SPs you can run the following code:

SELECT DB_NAME(st.dbid) DBName
,OBJECT_SCHEMA_NAME(st.objectid,dbid) SchemaName
,OBJECT_NAME(st.objectid,dbid) StoredProcedure
,sum(qs.execution_count) Execution_count
FROM sys.dm_exec_cached_plans
cp join sys.dm_exec_query_stats qs on cp.plan_handle = qs.plan_handle
CROSS APPLY sys.dm_exec_sql_text(cp.plan_handle) st
where DB_NAME(st.dbid) is not null and cp.objtype = 'proc'
group by DB_NAME(st.dbid),OBJECT_SCHEMA_NAME(objectid,st.dbid),
OBJECT_NAME(objectid,st.dbid)
order by sum(qs.execution_count) desc
Here I used the plan_handle of the “sys.dm_exec_cached_plans” DMV to join with the “sys.dm_exec_query_stats” DMV to obtain the “Execution_count” value where the object type is a store procedure. The “execution_count” column of the “sys.dm_exec_query_stats” DMV identifies the number of time the cached_plan (or SP) has been executed since the last compilation of the SP. I use the plan_handle in conjunction with the CROSS APPLY operator to return the object information (DBName, SchemaName, and ObjectName) using the table-value DMF “sys.dm_exec_sql_text”. The output from this SELECT statement is ordered by the execution_count, so the SP with the most executions will be displayed first.

Determining Which SP is using the Most CPU, I/O, or has the Longest Duration.
Knowing which SPs are frequently executed is useful information, although from a performance standpoint you might like to know which SP is consuming the greatest amount of CPU resources. Or possibly you might be interested in which SP takes the longest to run, or which SP performs the most physical I/O operations. By modifying the above command, we can easily answer each one of these questions.

If you want to show the SP that consumes the most CPU resources, you can run the following TSQL command:

SELECT DB_NAME(st.dbid) DBName
,OBJECT_SCHEMA_NAME(st.objectid,dbid) SchemaName
,OBJECT_NAME(st.objectid,dbid) StoredProcedure
,sum(qs.execution_count) Execution_count
,sum(qs.total_worker_time) total_cpu_time
,sum(qs.total_worker_time) / (sum(qs.execution_count) * 1.0) avg_cpu_time

FROM sys.dm_exec_cached_plans cp join sys.dm_exec_query_stats qs on cp.plan_handle = qs.plan_handle
CROSS APPLY sys.dm_exec_sql_text(cp.plan_handle) st
where DB_NAME(st.dbid) is not null and cp.objtype = 'proc'
group by DB_NAME(st.dbid),OBJECT_SCHEMA_NAME(objectid,st.dbid), OBJECT_NAME(objectid,st.dbid)
order by sum(qs.total_worker_time) desc

The “sys.dm_exec_query_stats” view contains the column “total_worker_time”, which is the total number of microseconds that a given cached query plan has executed. Keep in mind that cached plans are sometimes removed from memory and replaced with newer ones. Therefore, the statistics for which SP has consumed the most CPU only takes into account statistics for those plans that are in the cache when this T-SQL is run.

To determine which SP has executed the most I/O requests you can run the following TSQL code:

SELECT DB_NAME(st.dbid) DBName
,OBJECT_SCHEMA_NAME(objectid,st.dbid) SchemaName
,OBJECT_NAME(objectid,st.dbid) StoredProcedure
,sum(execution_count) execution_count
,sum(qs.total_physical_reads + qs.total_logical_reads + qs.total_logical_writes) total_IO
,sum(qs.total_physical_reads + qs.total_logical_reads + qs.total_logical_writes) / sum(execution_count) avg_total_IO
,sum(qs.total_physical_reads) total_physical_reads
,sum(qs.total_physical_reads) / (sum(execution_count) * 1.0) avg_physical_read
,sum(qs.total_logical_reads) total_logical_reads
,sum(qs.total_logical_reads) / (sum(execution_count) * 1.0) avg_logical_read
,sum(qs.total_logical_writes) total_logical_writes
,sum(qs.total_logical_writes) / (sum(execution_count) * 1.0) avg_logical_writes
FROM sys.dm_exec_query_stats qs CROSS APPLY sys.dm_exec_sql_text(qs.plan_handle) st
join sys.dm_exec_cached_plans cp on qs.plan_handle = cp.plan_handle
where DB_NAME(st.dbid) is not null and cp.objtype = 'proc'
group by DB_NAME(st.dbid),OBJECT_SCHEMA_NAME(objectid,st.dbid), OBJECT_NAME(objectid,st.dbid)
order by sum(qs.total_physical_reads + qs.total_logical_reads + qs.total_logical_writes) desc

Here I have displayed the total physical and logical read I/O’s, plus the logical write I/O’s. In addition, I have calculated the average number of I/O’s per execution of each SP. Physical reads are the number of reads that are actually made against the physical disk drives; where as logical reads and writes are the number of I/O’s against the cached data pages in memory in the buffer cache. Therefore, by adding the physical and logical I/O’s together I was able to calculate the total I/O’s for each SP.

To determine which SPs take the longest time to execute I can use the follow TSQL code:

SELECT DB_NAME(st.dbid) DBName
,OBJECT_SCHEMA_NAME(objectid,st.dbid) SchemaName
,OBJECT_NAME(objectid,st.dbid) StoredProcedure
,sum(execution_count) execution_count
,sum(qs.total_elapsed_time) total_elapsed_time
,sum(qs.total_elapsed_time) / sum(execution_count) avg_elapsed_time
FROM sys.dm_exec_query_stats qs CROSS APPLY sys.dm_exec_sql_text(qs.plan_handle) st
join sys.dm_exec_cached_plans cp on qs.plan_handle = cp.plan_handle
where DB_NAME(st.dbid) is not null and cp.objtype = 'proc'
group by DB_NAME(st.dbid),OBJECT_SCHEMA_NAME(objectid,st.dbid), OBJECT_NAME(objectid,st.dbid)
order by sum(qs.total_elapsed_time) desc
In this TSQL, I am calculating the duration of each SP by summing up the “total_elapsed_time” in the “sys.dm_exec_sql_query_stats” DMV by database, schema and object name. I am also calculating the average elapsed time per execution of each SP. I order the output so the SP that took the longest total duration will be displayed first. If you where interested in determining the SP that had the longest average duration all you would need to change is the “ORDER BY” clause to sort by “avg_elapsed_time”.

ConclusionThe “sys.dm_exec_query_stats” SP is used to look at the accumulated statistics for cached plans. By joining the “sys.dm_exec_query_stats” view with other DMVs, you can determine other information about the cached plan, like the object type for the cached plan, and the actual name of the object. Having these DMVs in SQL Server 2005 now provides you with some data mining tools to review some performance information for a SQL Server instance. Next time you want to review statistics related to your code run on your SQL Server box consider looking at the information available in the SQL Server 2005 dynamic management views.

Data Governance Learning Plan

Seven courses to build the knowledge of Data Governance Program ( planning & establishment ) by Kelle O'Neal with 100 MCQs Exam 1....